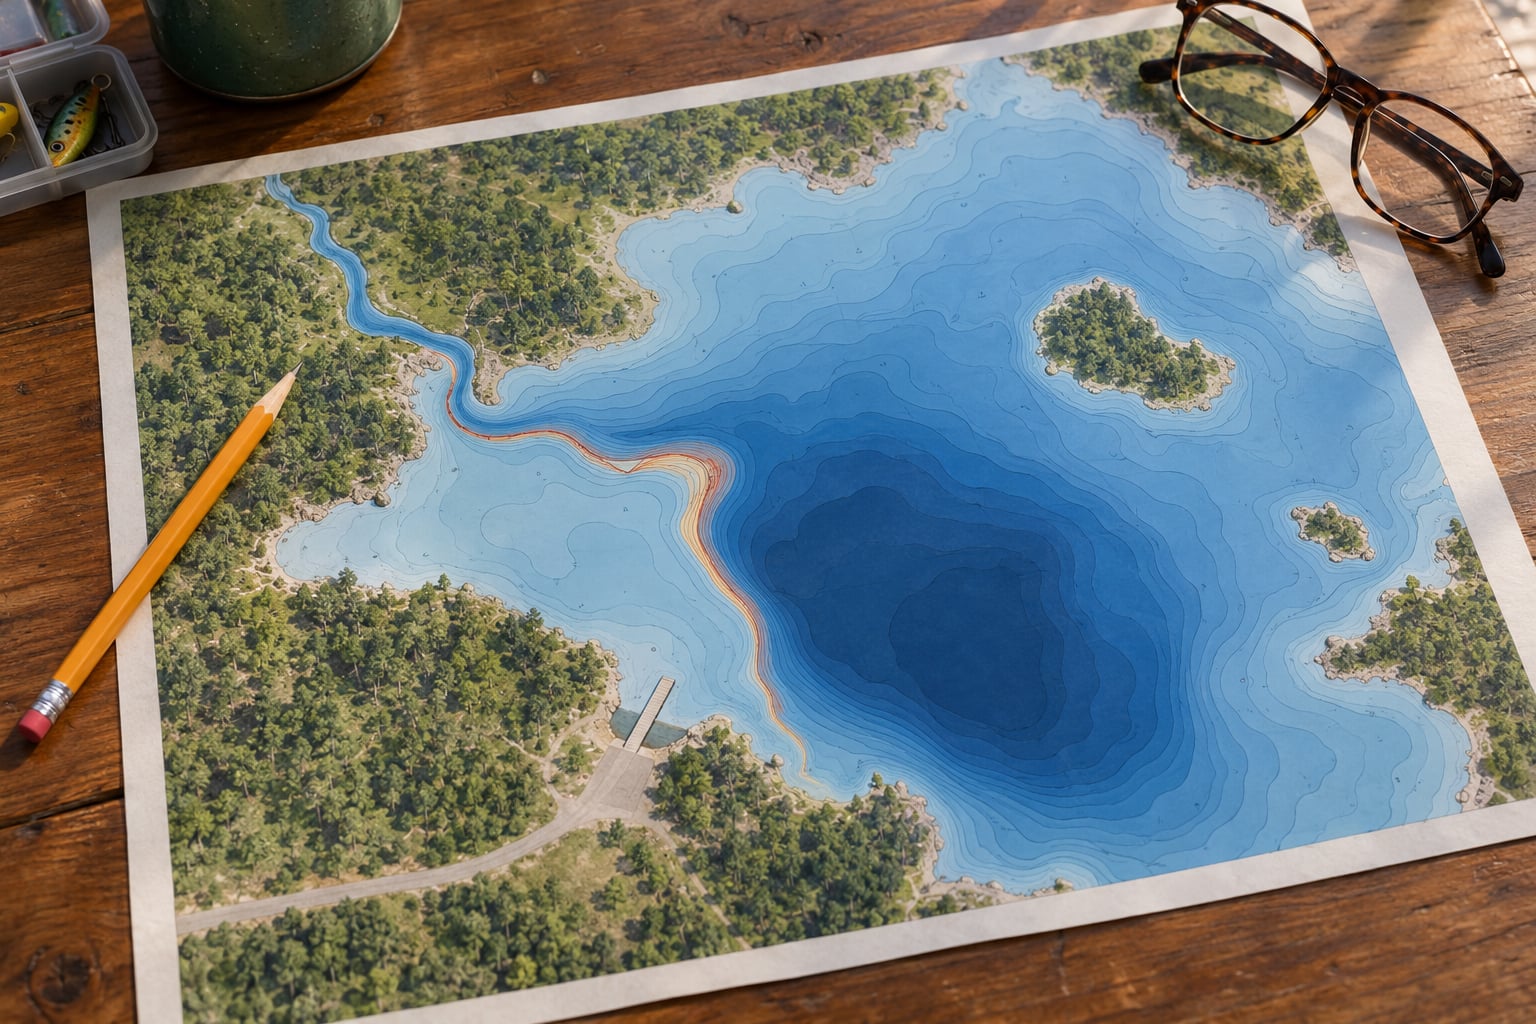
A lake map for fishing is a bathymetric chart, and the whole thing works on one idea: each contour line connects points of equal depth, so the distance between lines tells you how fast the bottom rises or drops. Learn that one skill and a map stops being a pretty picture and turns into a list of places worth burning fuel on. Twenty minutes with a chart at the kitchen table usually saves a day of running blank water.
This guide walks through the whole process, from finding a map to choosing where to put the boat. It works for print charts, chartplotter subscriptions and screenshots taken off satellite imagery, though the fine detail is better on some than others. Beginners get the most out of it once they stop asking where the fish are and start asking what the bottom is doing.
Table of Contents
- What You Need
- How to Read a Lake Map for Fishing: Step-by-Step
- Common Mistakes
- Starting with the features instead of the legend
- Judging contour spacing by eye, not against the surrounding area
- Using an old or wrong chart
- Expecting the map to show cover
- Treating the map as live conditions
- Picking the spot before picking the access
- Forgetting that the same map means different things in different months
- Frequently Asked Questions
- Conclusion
What You Need
You need a map, something to mark it with, and about twenty minutes of attention to the legend before anything else. That is the whole toolkit. Everything beyond it just makes the same reading faster.
- A map source. State natural resources departments publish bathymetric charts for many public lakes, often as free PDF or paper copies. Federal agencies cover national parks, reservoirs and some border waters. Coastal work uses nautical charts instead.
- A chartplotter or phone app subscription if you want zoomable detail and waypoint storage. Garmin, Navionics, LakeMaster and C-MAP all sell regional chart packages for the common electronics brands.
- Satellite imagery from Google Earth, which is genuinely useful for one thing only: finding where creeks and rivers enter the lake, because those entries nearly always lead to fishable structure.
- A pencil, pen and a printed copy. Digital charts are wonderful for navigation and terrible for scribbling on. Print the page you care about and mark it up.
- Your own sonar recordings. Any depth data you log becomes your own map, and it is the only version that is guaranteed current.
Before you study anything on the map, find four pieces of information in the corner of the sheet.
The legend tells you what every symbol, line style and color band means. Never skip it. The scale tells you how much ground one inch covers, which is how you judge how far you must run to reach a feature. The contour interval tells you how many feet of depth sit between one line and the next, and this is the single most useful number on the sheet. The date and datum tell you how old the survey is and what water level it was drawn at.
That last one matters more than beginners expect. Bathymetric surveys taken in a low-water year describe a bottom that may sit a foot or two deeper under normal conditions. An old chart drawn from a reservoir before a dam changed the outflow can be badly wrong about the upper end.
How to Read a Lake Map for Fishing: Step-by-Step
Read the legend, then trace where the depth changes, match that to habitat and access, and only then decide where to fish. In that order, because each step depends on the one before it.
1. Start with the Map Legend and Scale
The legend is where the map explains itself, so read it before you read the lake. You are looking for four things: the contour interval, the depth shading bands, the symbols for boat ramps and hazards, and any markers for restricted or private shoreline.
Depth shading is the fast read for beginners. Bands of color, usually light for shallow and dark for deep, let you see the shape of the basin at a glance without tracing a single line. Shading is a summary, not a detail. It tells you where the deep water is, not where the edge between shallow and deep sits.
Then check the scale. On a small lake a one-inch span might cover 500 feet of water. On a big reservoir it might cover half a mile, which means features that look identical in shape are wildly different in distance. Scale is how you convert a promising mark on paper into a run you can actually make.
You know the legend is done when you can look at any symbol on the sheet and say what it is without hunting for the key.
2. Find the Lake’s Contours and Structure
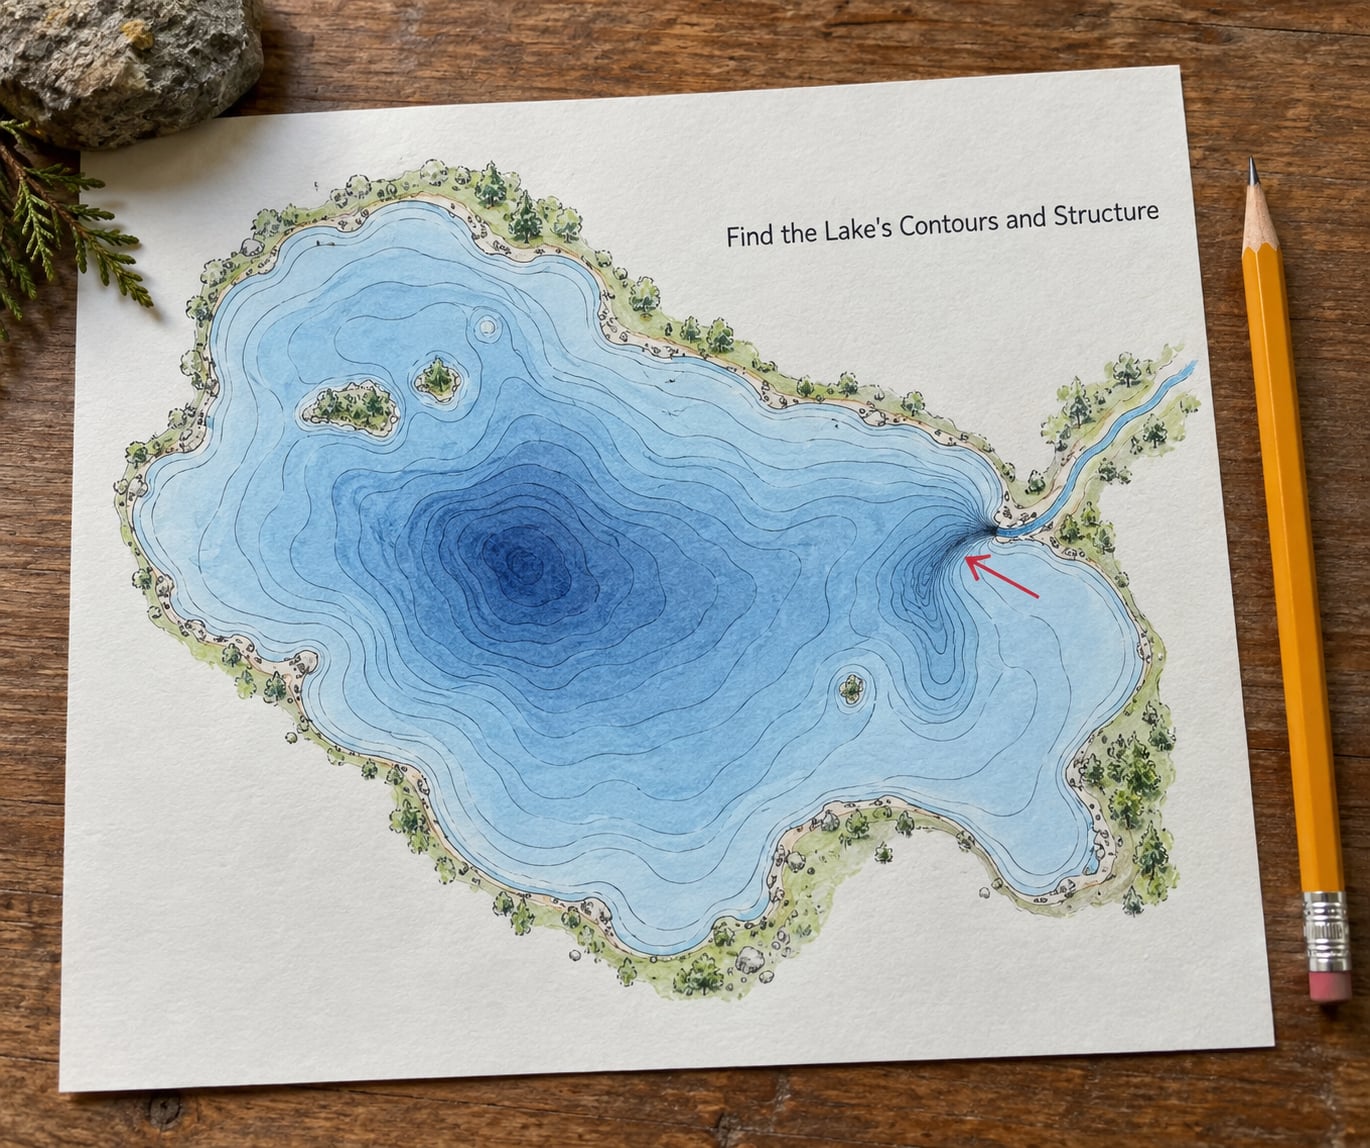
Close contour lines mean a steep bottom, and spread-out lines mean a gradual one. That is the entire reading. Every named feature on every fishing chart, from a ledge to a channel swing, is just a pattern of line spacing.
Think of it as walking downstairs. Each contour line is one step down, and the interval is how deep that step is. If the steps come fast, you are looking at a drop. If they come slowly, you are looking at a ramp.
Three spacing patterns cover most of what you will see on a chart:
- Tight lines. Several contours crowded into a short run of paper. That is a ledge or a drop-off, and fish often hold right along it because they can pick food off the deeper water without giving up the ability to see what is coming.
- Moderate spacing. A steady slope. Productive but not dramatic, and worth working when you know what is feeding nearby.
- Spread-out lines. A flat, a shelf or a shallow plateau. Charts often label these flats, and that is exactly right, because baitfish tend to spread out over them in summer.
So how do you find drop-offs when every contour on the chart looks the same? Compare spacing to the surrounding area instead of to an absolute number. Plenty of anglers get stuck on three- or five-foot interval charts because they are measuring lines by eye against the page. Mark one spot where the lines crowd, then walk the sheet and look for other places that crowd the same way relative to their own neighbors.
The contour interval decides how much you can honestly see:
| Contour interval | What it shows you | What it hides |
|---|---|---|
| 3 foot | Fine ledges, small humps, gentle saddles | Nothing much, but the sheet gets busy fast |
| 5 foot | The features most anglers actually fish | Small step changes that a bass will notice |
| 10 foot | Basin shape, major channels, the big picture | Most ledge fishing opportunities |
There is one more pattern worth watching for: contour lines that touch or bunch together at the mouth of a river or creek channel, and sometimes at a point. Wherever the spacing stops looking even, your attention is already needed.
Trace each feature along its length rather than stopping at the first tight spot. A ledge that runs 300 feet along a bank holds very different fish at its north end than at its south end, and the map usually hints at why.
3. Match Features to Fish Habitat
Structure is the shape of the bottom. Cover is the stuff growing or sitting on it, and a chart shows you the first one almost perfectly and the second one not at all. Beginners mix these two up constantly, then feel betrayed when the spot they marked on paper comes up bare.
No map, printed or digital, will tell you where the brush piles are, which rock is hard and which is soft, or where the current runs hardest. That is sonar information, and it arrives only when you get there.
What the map does give you is where fish are most likely to be holding relative to cover. Points, channel bends, drop-off edges and the mouths of creeks are structure. Cover attaches to structure, so choosing structure first narrows your search even before you know what the bottom is made of.
The classic pattern worth memorizing: a hard bottom next to a soft bottom, a depth change near a spawning area, and a channel swing that puts deep water within a short cast of shallow water. Keep the method simple. Study the depth map for whichever lake you are on, find the good drop-offs, and work them.
Connect mapped features to habitat in the direction the water moves. Every tributary, bayou inlet and creek mouth on the chart should have a channel running away from it, and where that channel bends, look for a ledge or a point on the outside of the bend. That is where current-sorted bottom tends to gather fish.
4. Mark Access, Routes, and Safe Boundaries
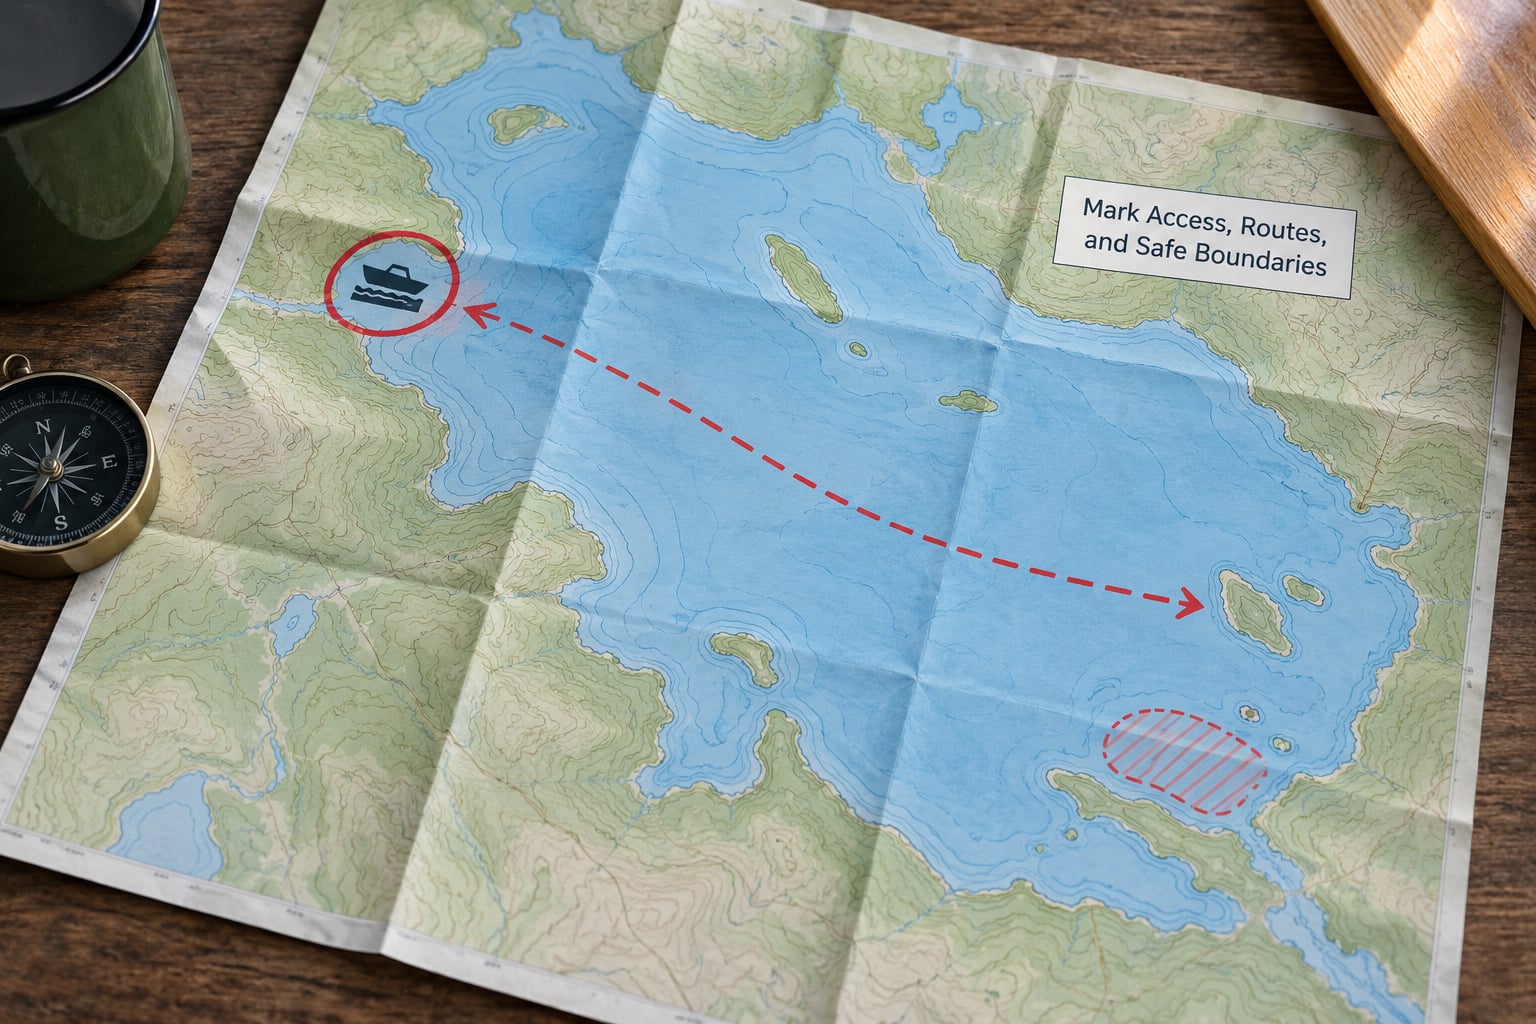
Marking access, routes and hazards is what turns a good fishing map into a safe trip. Most charts show boat ramps, but many recreational maps do not show shoals, stale water or private shoreline clearly enough to rely on at speed.
On the map, circle every ramp you could realistically use and note which ones belong to the state, a marina or a private campground. Then draw the route from the ramp you will actually use to the first spot you want to fish.
Drawing that route is the step most people skip, and it is the one that prevents most bad afternoons. A feature that looks like a ten-minute run from the ramp is often on the far side of a winding channel, and you learn that on the clock.
Mark the hazards as you go. Shallow bars at the mouth of a river, stump fields in a reservoir headwater, submerged roadbeds and flooded brush near old creek channels all sit in water that a chart may draw as simply shallow. Watch depth shading on the approach, not just at the destination.
Also mark the landmarks you will actually see: a marina, a bridge, a large island, a rocky point with a distinctive tree line. When you are tired and the light is going flat, a landmark is worth more than a coordinate.
5. Turn Map Knowledge into Fishing Decisions
Turn map knowledge into fishing decisions by ranking your marks instead of fishing them all. Use a repeatable comparison of depth, structure, cover, season, water flow and access, and give each candidate spot a simple score.
Here is the method I use. First, list five to eight candidate features from the chart. Then score each one on the same six questions:
- Depth transition. Is there a real change in depth here, or is it just deep water?
- Proximity to a feature that funnels bait. A creek mouth, a channel bend, a point tip, a confluence.
- Season fit. Does the depth make sense right now, given water temperature and how the fish are likely distributing?
- Water level. Is the feature exposed by a drawdown, or drowned and irrelevant this year?
- Access. Can you get there safely and comfortably in the wind you expect?
- Water flow. Where does current concentrate, and is it running clear or stained?
Fishing depth is not something the chart decides for you, it is something the chart narrows down. A feature that scores well on everything except season may be a better trip in May than later in the season.
Species focus is another way to read the same chart differently:
| Species | Depth range to look for | Structures to mark first |
|---|---|---|
| Bass | Shallow to mid depth with a nearby drop | Ledges, secondary drops, points, creek channels with nearby cover |
| Walleye | Mid to deep, often over sand or rock | Channel edges, inside bends of the river channel, deep saddles |
| Catfish | Deep, along channel edges and holes | River channel, channel swings, steep banks, hard bottom |
| Panfish | Shallow, warm, sheltered | Flats, coves, brush near structure, creek mouths |
Write the ranking down before you launch. Then fish your top two marks first, in the order you scored them, and change the plan only when the water gives you a reason.
Keep a log. Three pieces of paper in the console: the chart, the marks you make, and a note on what each one produced. After a handful of trips you will have a map of your own, drawn in experience, that no chart app can give you. Anglers have been doing exactly this for a long time, tracing charts off a screen and then marking depths and channels by hand after each outing.
Common Mistakes
The mistakes below are all recoverable, and all of them are common enough that you will probably make at least one this season.
Starting with the features instead of the legend
Beginners flip straight to the interesting parts of the lake and never find out what the lines mean. Then they spend an afternoon misreading them. Spend five minutes in the legend first and every later step gets easier.
Judging contour spacing by eye, not against the surrounding area
Absolute spacing tells you little on a fine-interval chart. What tells you something is a change in spacing relative to the water around it. Mark the tightest spot on the sheet, then look for other places that behave the same way.
Using an old or wrong chart
A survey from a low-water year, or a reservoir chart from before the water body changed its level regime, will send you to places that no longer exist in that form. Check the survey date and the water level the chart was drawn at. If it is decades old on a regulated reservoir, treat every shallow reading as a guess.
Expecting the map to show cover
Bushes, rock, timber, stumps and clams do not appear on a bathymetric chart. A map can tell you the point is there and that a ledge runs under it. It cannot tell you that the point is covered in willow. Bring sonar.
Treating the map as live conditions
A chart shows the bottom, not the water above it. Clarity, current, wind direction, water temperature and level can all make a mapped feature fishable one day and dead the next. Check the forecast and any recent local reports before you commit to a run.
Picking the spot before picking the access
A brilliant feature on the wrong side of the lake, behind a shoal in a rising wind, is a bad decision made early. Rank access and hazards alongside the fishing quality, not after it.
Forgetting that the same map means different things in different months
In spring, fish move to shallow points and creek channels and the deepest water goes quiet. Through summer, fish push to shade, structure and the coolest water available. In fall they follow baitfish back toward the middle, and under ice everything compresses. The chart does not change. The ranking does.
Frequently Asked Questions
What is a lake depth map called?
A lake depth map is called a bathymetric map or bathymetric chart. Other names for the same thing are a depth chart, a fishing chart, a contour map or a lake survey chart. It shows the shape of the bottom using contour lines, each one connecting points of equal depth.
How does a contour map work?
Sonar sends a sound wave at the bottom and measures how long the echo takes to return. That delay becomes a depth measurement. Surveyors or boaters plot thousands of those measurements and connect the ones at equal depth, so every contour line joins points at the same depth. The interval between lines is constant across the whole chart.
What do close contour lines mean on a fishing map?
Close contour lines mean the depth changes fast. In practical terms, tight lines mark a drop-off or ledge, where the bottom falls away sharply and fish can hold close to deeper water. Spread-out lines mean a gradual slope or a flat. Compare spacing to the surrounding area rather than measuring it by eye against the page.
What is the best app for finding lake fishing maps?
For free depth data, start with your state natural resources department, which often publishes bathymetric charts as PDFs. For on-the-water navigation and waypoint storage, Garmin, Navionics, LakeMaster and C-MAP all sell regional chart packages for common electronics brands. Google Earth is a good companion for finding creek and river entries, though it shows little underwater detail.
How do I use Google Maps for fishing spots?
Use satellite imagery for the shoreline and the water above it, not for the bottom. Zoom in and note every creek mouth, bayou inlet, river confluence and dam, because each one usually corresponds to a channel or a drop on the chart. Then match those entries to the depth contours on your bathymetric chart and you have a short candidate list in a few minutes.
What can a lake map not tell me about a fishing spot?
A map shows depth and shape, not composition. It will not tell you where brush, rock, timber or clams are, whether the bottom is hard or soft, how strong the current runs, or what the water temperature and clarity are doing. Those come from sonar, observation and local knowledge once you are on the water.
Conclusion
Start at the corner of the map, not on the lake. Find the contour interval, the legend and the survey date, then mark three depth transitions, two access points and one safe route to each of them. When you are done, you have a short ranked list instead of a whole lake of guesses, and learning how to read a lake map for fishing gets easier every time you do it again on different water.