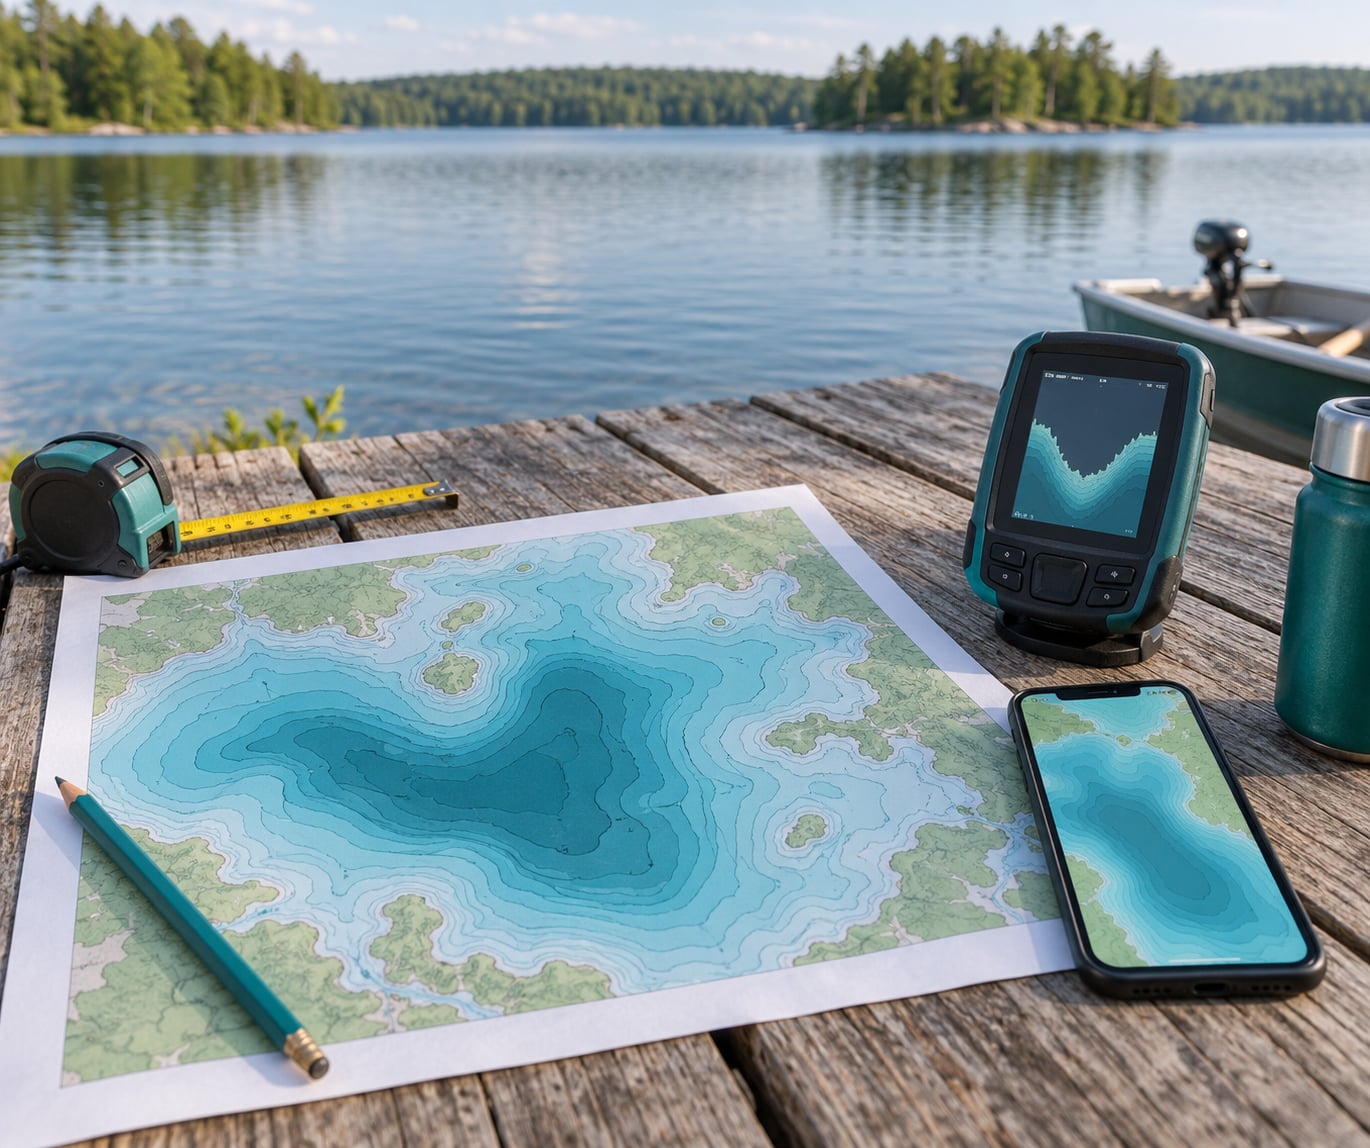
A topographic lake map is a depth chart that draws the bottom of a lake using contour lines, and every place those lines bunch up tight marks underwater structure worth fishing. Learning how to use a topographic lake map to find structure takes about 20 minutes of study and saves you a full day of casting at random water.
The method is simple once you have the vocabulary: read the shape of the lake, find out how many feet separate one contour line from the next, then look for spots where the depth changes fast. Anyone can pick up how to read a bathymetric map in an afternoon, and the skill pays off every season after that.
Most beginners get stuck on one thing, the contour interval, which is just the number of feet between one line and the next. If you cannot read it off the chart, every depth estimate you make is a guess. So that is where we start.
What You Need
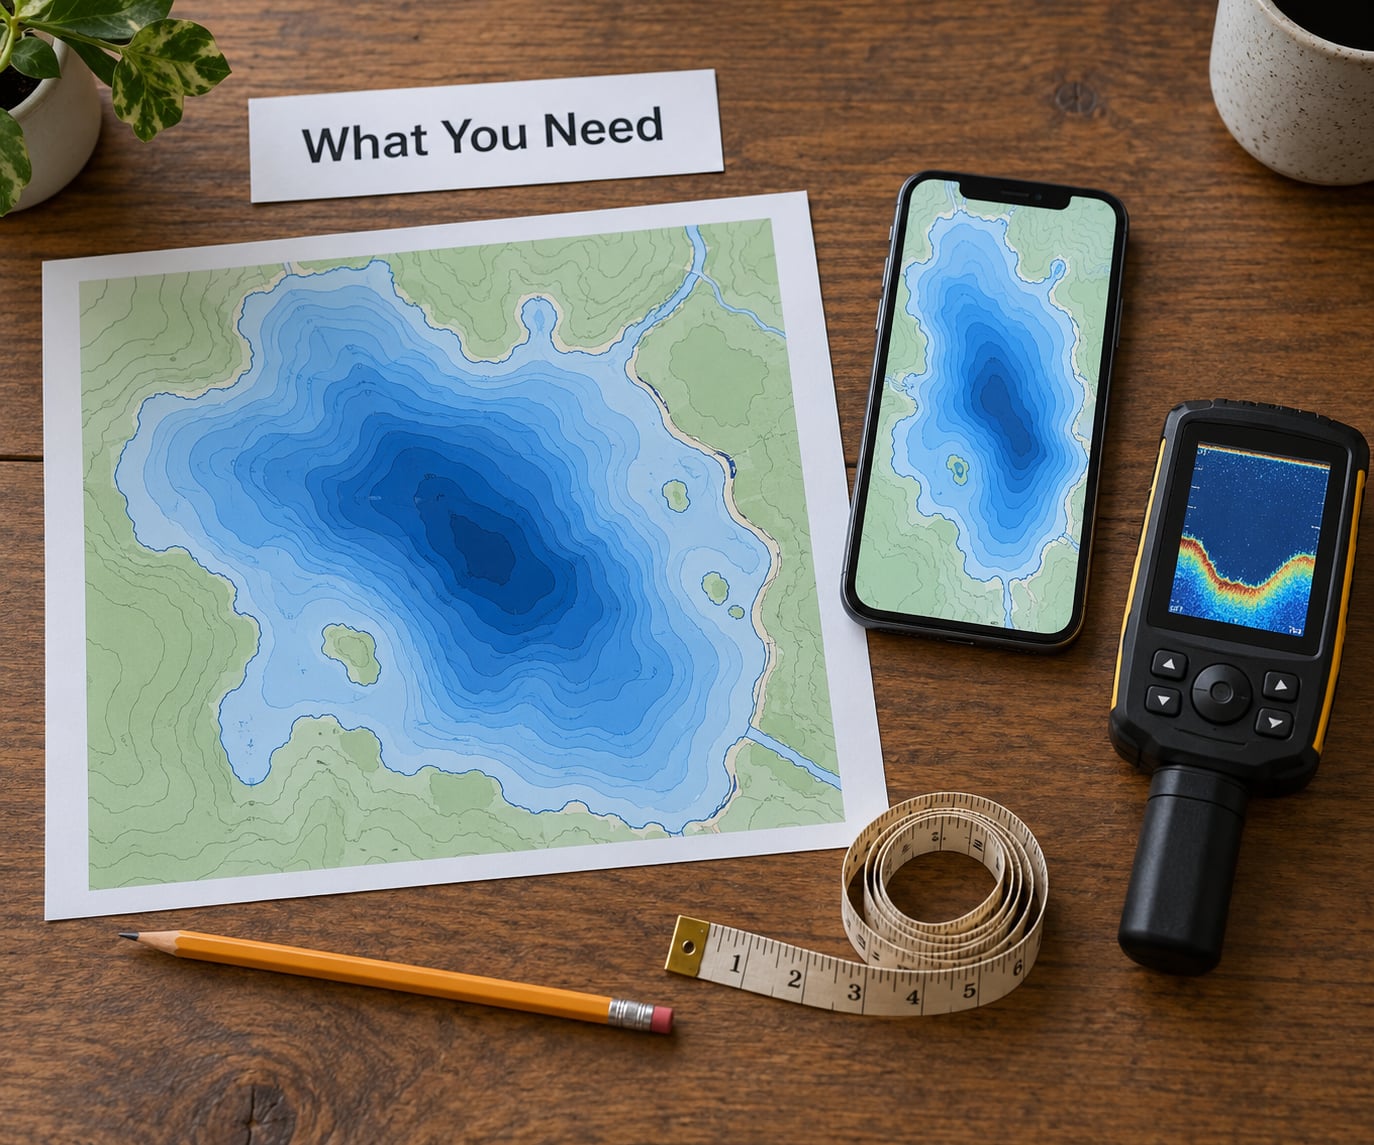
Four things, really. Everything else is optional.
A bathymetric chart from your state. Search your state’s department of natural resources or similar agency for the lake finder or lake maps page. These show depth, and they are almost always free. A road topographic map sold at outdoor shops is a different animal, so do not buy one expecting underwater contours.
The chart’s own information. Every bathymetric sheet has a legend and a stated contour interval, usually somewhere near the title block. Read both before you look at any water.
Two versions. Print one. A paper chart in a dry bag survives wind, spray and a dead phone battery, and you can scribble on it with a pencil. Keep a phone or tablet version for zooming and for entering waypoints.
A way to mark and verify. A handheld GPS, your phone’s map app, or your boat’s electronics. A depth sounder or fish finder turns the map from a guess into a plan, but it is not required to learn the map.
Step-by-Step
The order matters more than the effort. Work the outline of the lake, then the numbers, then the depth changes, then the spots you can reach, and only then the water. Learning how to use a topographic lake map to find structure in that sequence keeps you from marking a dozen places before you know what the contour numbers even mean.
Start With the Lake’s Shape and Scale
Before you chase depth, spend five minutes on the outline of the lake. Where does the shoreline pinch, and where does it flare out? Those shapes tell you where the structure will be.
Walk the shoreline with a pencil and mark every point that runs out into the water, every creek mouth, every island and every narrows where the water squeezes between land masses. On a typical northern lake this takes you ten minutes and it fills your chart with candidates before you have read a single depth number.
Then check the scale bar. A one-inch scale means one inch of paper is one inch of lake. Most lake charts run somewhere around 1:2,000 to 1:24,000, which is why a structure that is productive to fish looks like a smudge on a whole-lake view.
Zoom in until the feature you care about is clearly visible, not until the shoreline fills your screen. There is a practical ceiling here, and past it you are looking at survey noise instead of shape.
Read Depth Contours and Spot Abrupt Changes
Every contour line on a bathymetric chart connects points of equal depth. That single rule does most of the work. Close lines mean the bottom falls away fast, wide lines mean it tapers gradually.
Finding the contour interval takes ten seconds. Read the printed depth number on one line, then read the number on the next line. The difference between those two numbers is the interval. On a small lake you may get 1-foot intervals, and on a big flooded river system you may get 5 or 10. Do not assume, because getting it wrong doubles or halves every depth you estimate.
Once you know the interval, you can measure structure without a single additional number. Look at the shore and count lines as they stack up. Four tightly packed lines on a 1-foot interval chart means the bottom drops about 4 feet across a very short horizontal distance, and that is a drop-off worth fishing along its edge.
Angler forums are full of the same question, asked differently each time: is every place the depth changes from 10 to 12 feet a breakline? No. A breakline is a distinct, traceable edge where depth changes fast enough that you can follow it with a finger. A gentle 2-foot lift over a hundred yards is not a breakline, it is just a slope, and marking every gentle slope is how beginners end up with a game plan full of mediocre spots.
The rules most anglers need are short. Contour lines never cross. They do not branch or split. Each one is a closed loop around a high spot or a hole, unless it runs off the edge of the chart. Depth increases away from the middle of a closed loop on a submerged hump, and increases toward the middle on a basin. A contour line never wiggles randomly, so any irregularity is a real feature of the bottom.
One more: closer lines do not mean deeper water, they mean steeper water. Novices mix these up constantly, and it throws off the whole reading.
Connect Shoreline Features to Underwater Structure
Shoreline shape and underwater depth are not separate topics. The lake bottom usually mirrors the land above it, so features on shore tell you what to look for below.
| Shoreline feature | What it looks like on the chart | Why fish hold there |
|---|---|---|
| Point | A narrow finger of shallow water running out from a bend, usually ringed by tight contours | Bait gathers on the point and drops hang near the edge beside it |
| Creek mouth or inlet | A channel of deeper color lines reaching into the lake | Current brings food in and the channel is a travel lane to deep water |
| Channel swing | The deep channel bends away from a straight line, putting deep water beside a shallow flat | Fish reach deep safety without leaving the feeding area |
| Island | A soft, gradual halo of contours with a steep edge on one or two sides | The steep side gives depth access, the shallow side gives cover and warmth |
| Narrows or a constriction | Two shorelines pinching together with structure squeezed into a short stretch | Every fish crossing the pinch meets the edge in a very short distance |
| Mid-lake bar or hump | A closed loop of shallow contours rising out of deep water | Baitfish concentrate on the top and the drop-off behind it gives quick depth |
That table is the fastest way to speed up map study. Find the feature on the shore, look at the depth directly in front of it, and you have your candidate.
Mark and Compare High-Value Fishing Areas
Marking everything is not a strategy. You want three spots on the chart, one primary and two backups, and the deciding factor is almost always access.
Rate each candidate on four things: how sharp the depth change is, how long the edge runs, how close it is to your boat ramp or your bank, and whether you can find it again without hunting. A short, steep, easy-to-reach break usually beats a longer one you will spend twenty minutes searching for.
If you are fishing from shore, the math changes completely. Only structure touching the shoreline is reachable without a boat, which means points, the near side of channels, the shallow bay next to a deep drop, and any breakline that comes within a short cast of a bank. Mid-lake humps and channel swings can be outstanding spots and they are simply not on your list if you are wading in hip boots. Knowing how to read a lake map for access is its own skill, and it starts with which ramp or shoreline you can actually get to.
In a small boat or a kayak, you can reach almost anything within a mile of your launch, which turns the decision into a question of time rather than access. Rank by what you can hit first given the wind and the clock.
Now write the three down in a consistent way. Gilligan 1, 12 feet, top of the drop-off, rocky. Gilligan 2, where the drop flattens to mud. Numbers, a description, and something you will recognize next time. Anglers who name their spots report the same thing: the biggest gain is not finding the spot, it is finding it again on the second trip.
Verify the Map in the Water
Run each mark slowly with the sounder on and compare what you see to what the chart predicted. If the chart shows a break and the sounder shows a gentle slope all the way across, you have learned something useful about that survey’s age.
Write down what the map cannot tell you: bottom type, vegetation, current and cover. One pass across a spot at idle speed gives you all four, and that log is what makes the next trip productive. A map tells you where the depth is, and the sounder tells you what is down there.
Have a move rule before you leave the ramp. Something simple works: if the primary spot produces nothing after a defined effort, and one backup is reachable in under fifteen minutes, you go. Deciding in advance keeps you from drifting into the nearest unproductive water and calling it fishing.
Most anglers who adopt this habit say the same thing, that verifying on the water is what turns a chart into knowledge. People on fishing forums describe the opposite case too, drilling fifteen holes to relocate a weed line they never marked, which is a slow and expensive way to learn the lesson.
Common Mistakes
Guessing the contour interval. Read the numbers on two adjacent lines and subtract. This is the single highest-return habit on the whole chart.
Treating every depth change as a breakline. A breakline is an edge you can trace with a finger. A slow slope is not structure, and marking it fills your day with wasted time.
Studying the map at the wrong scale. A whole-lake view hides the exact detail you need. Zoom to the point where contours are distinguishable, then mark there.
Trusting a survey you have not dated. Siltation, drawdown and development change a lake bottom over decades. Check the survey date on the sheet, and treat a big mismatch as information rather than a failure.
Choosing a mark you cannot reach. A hump you cannot get to is not a spot. Rank access above raw structure quality when you are limited to shore or a single battery.
Never logging results. Depth, bottom type, time of day, what you caught. Without notes you relearn the same lake every season, and free map study is the cheapest scouting tool available.
Frequently Asked Questions
What is a bathymetric map?
A bathymetric map is a chart of a body of water that uses contour lines to show water depth across the bottom. Every line connects points of equal depth, and where those lines bunch together the bottom drops away quickly. That tight spacing is where fish-holding structure lives. In most states you can download one free from the department of natural resources.
What is a typical contour interval on a lake map?
It depends on the lake. Small lakes and reservoirs often use 1-foot or 2-foot intervals, while larger flooded systems may use 5 or 10 feet. You do not have to guess: read the depth number printed on one contour line, read the number on the next one, and the difference is your interval. Knowing it lets you count lines instead of estimating depths by eye.
What do close contour lines indicate?
Close contour lines indicate a steep bottom, meaning depth changes fast over a short horizontal distance. A tight stack of lines running from shore is a drop-off or breakline. Lines spread far apart show a gradual taper, often a soft break or a flat. Closeness tells you the slope, not the depth, which is why you still need to read the printed numbers.
What kind of map shows lake depth?
A bathymetric chart, also called a hydrographic or lake depth map, shows underwater depth using contour lines. Free versions come from state natural resources agencies and are usually the best starting point. Road topographic maps show land elevation instead, so they will not give you what you need. Paper charts, phone apps and boat chartplotters all work if the underlying survey is detailed enough.
Will Google Maps work on a lake for fishing?
Not for depth. Google Maps is designed for roads and addresses, and it will not show you underwater contours, structure or a usable scale for a lake. It is fine for finding a boat ramp, a parking area or the shape of the shoreline. For structure you need a bathymetric chart from a state agency or a mapping app built for lakes.
Do bathymetric maps show bottom type and vegetation?
Almost never. A standard chart shows depth and sometimes surface features like rocks or stumps above water. Bottom composition, weed beds and current are left off. Some agencies publish separate aquatic plant surveys and substrate layers, which are worth finding, and sonar gives you bottom type in real time. Treat the chart as the starting point, not the whole plan.
Conclusion
Pick one section of the lake, zoom in until the contours are clear, find where the depth changes fastest, and choose one piece of structure you can actually reach from where you will be fishing. Mark it, write a name on it, and check your prediction against the sounder the first time you are there. That is the whole method, and it works on any lake you pull a chart for, this 2026 season or the next.